KPS Visualization
Brief description of the Algorithm
Kirkpatrick-seidel is an algorithm to compute the convex hull of a set of points by using a
Divide-and-Conquer approach. The Divide step comprises dividing the set of points into 2
equal subsets based on their x-coordinate relative to a median line, while in the Conquer step,
we recursively find the convex hull of each of subset. Finally, you merge the 2 convex hulls
by finding the upper and lower bridges.
Step-by-step Visualization
Step 1:
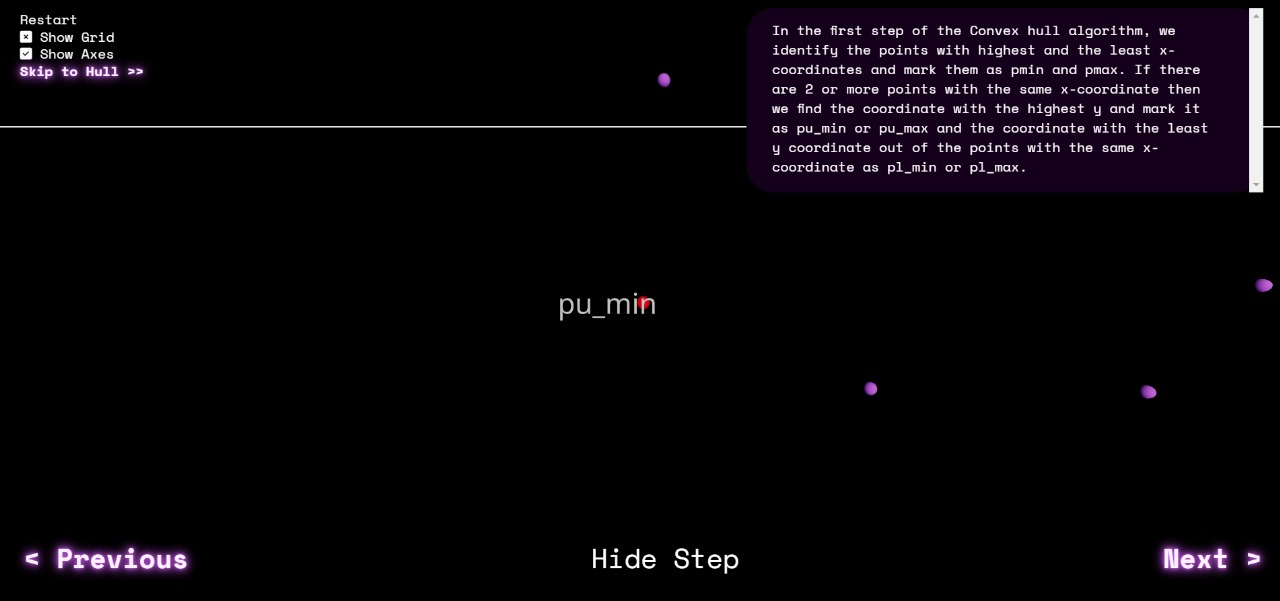
In the first step of the Convex hull algorithm, we identify the points with highest and the least x-coordinates and mark them as pmin and pmax. If there are 2 or more points with the same x-coordinate then we find the coordinate with the highest y and mark it as pu_min or pu_max and the coordinate with the least y coordinate out of the points with the same x-coordinate as pl_min or pl_max.
Step 2:
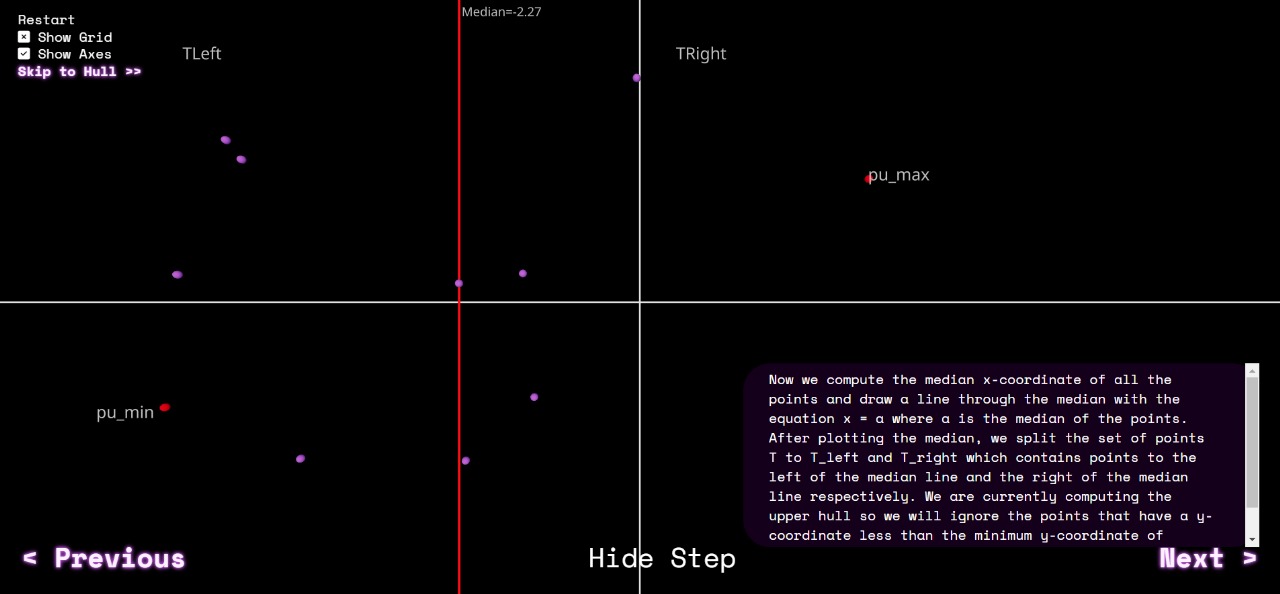
Now we compute the median x-coordinate of all the points and draw a line through the median with the equation x = a where a is the median of the points. After plotting the median, we split the set of points T to T_left and T_right which contains points to the left of the median line and the right of the median line respectively. We are currently computing the upper hull so we will ignore the points that have a y-coordinate less than the minimum y-coordinate of pu_min/pu_max. Finally, we will add pu_min to T_left and pu_max to T_right.
Step 3:
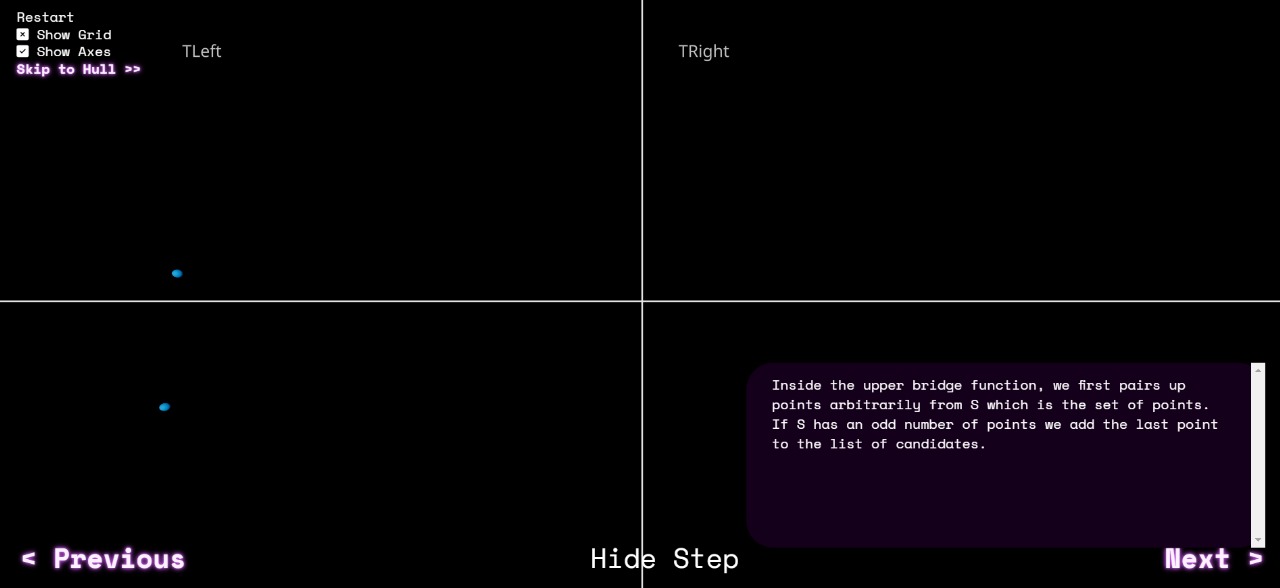
Inside the upper bridge function, we first pairs up points arbitrarily from S which is the set of points. If S has an odd number of points we add the last point to the list of candidates.
Step 4:
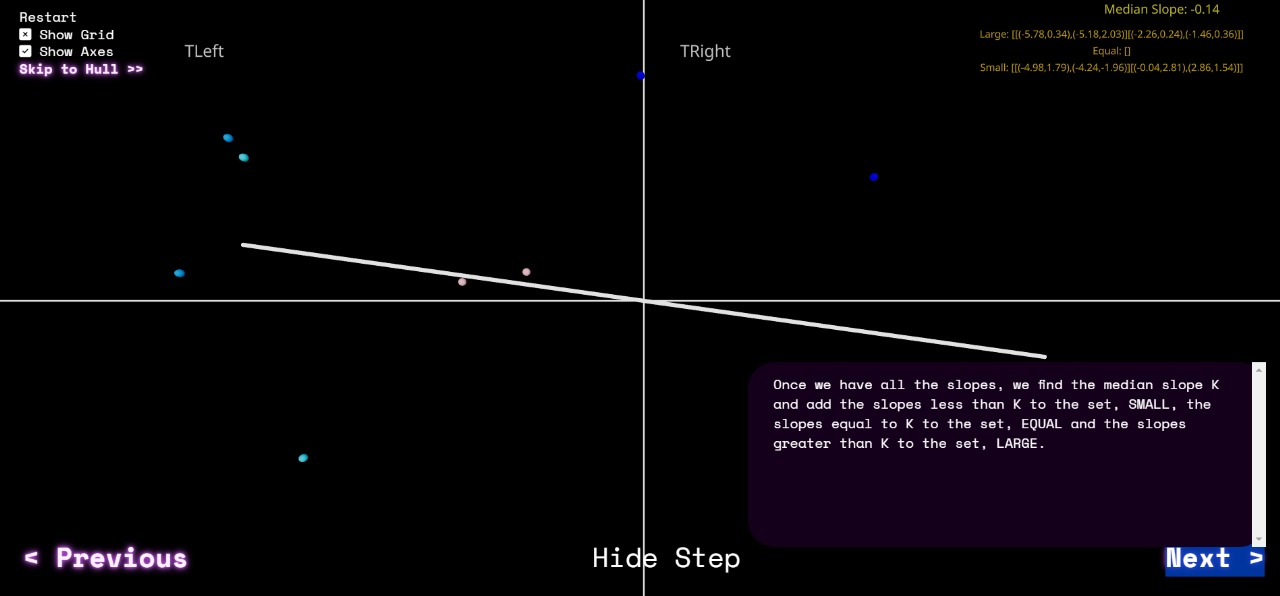
Once we have all the slopes, we find the median slope K and add the slopes less than K to the set, SMALL, the slopes equal to K to the set, EQUAL and the slopes greater than K to the set, LARGE.
Step 5:
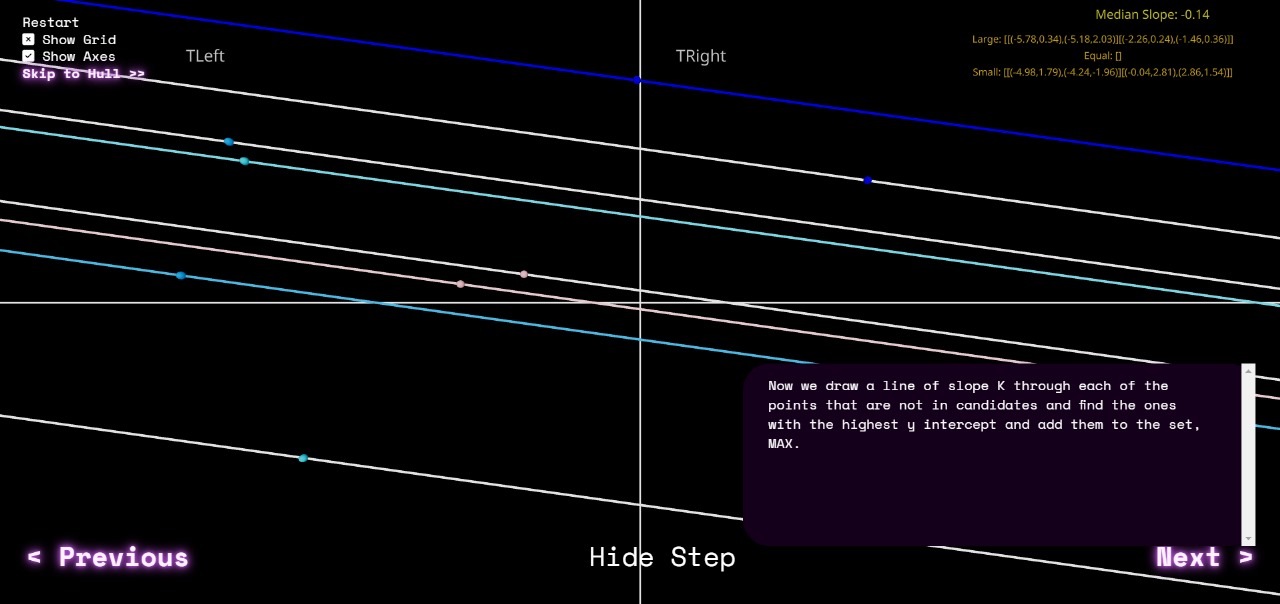
Now we draw a line of slope K through each of the points that are not in candidates and find the ones with the highest y intercept and add them to the set, MAX.
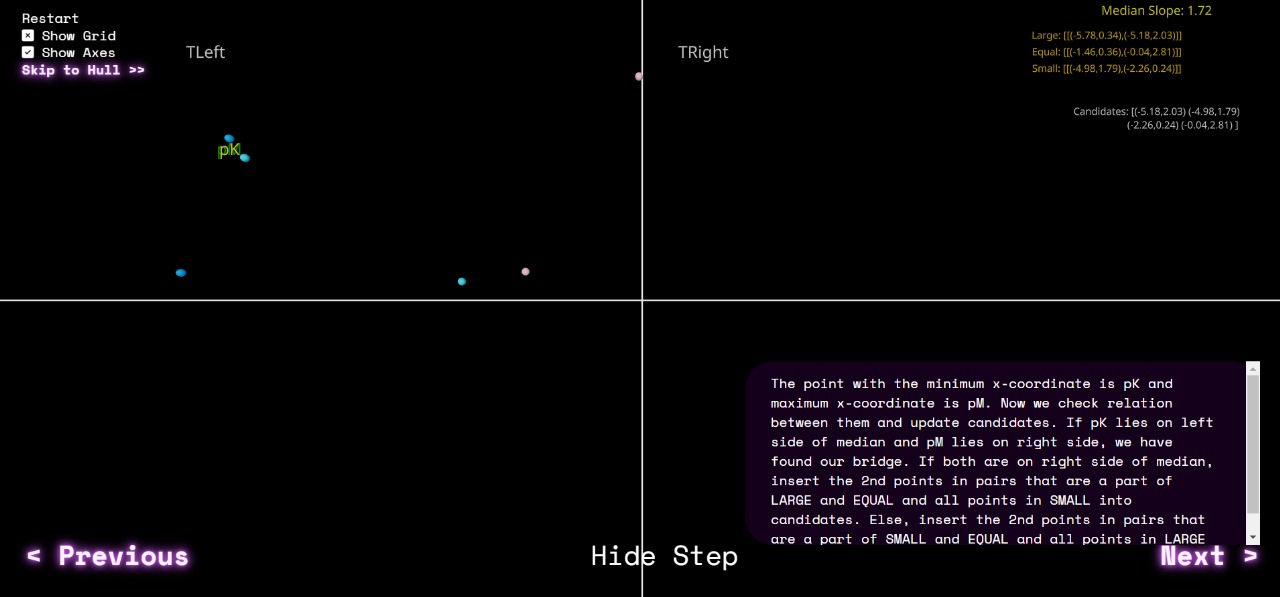
Step 6:
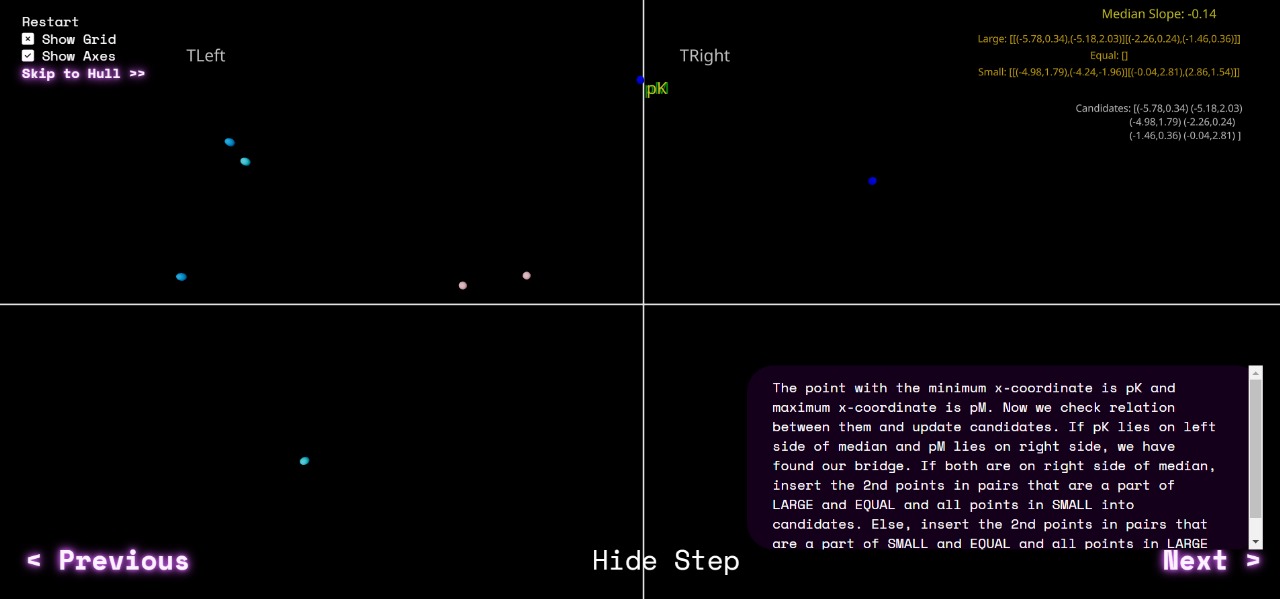
The point with the minimum x-coordinate is pK and maximum x-coordinate is pM. Now we check relation between them and update candidates. If pK lies on left side of median and pM lies on right side, we have found our bridge. If both are on right side of median, insert the 2nd points in pairs that are a part of LARGE and EQUAL and all points in SMALL into candidates. Else, insert the 2nd points in pairs that are a part of SMALL and EQUAL and all points in LARGE to candidates and find UpperBridge(Candidates,median).
Step 7:
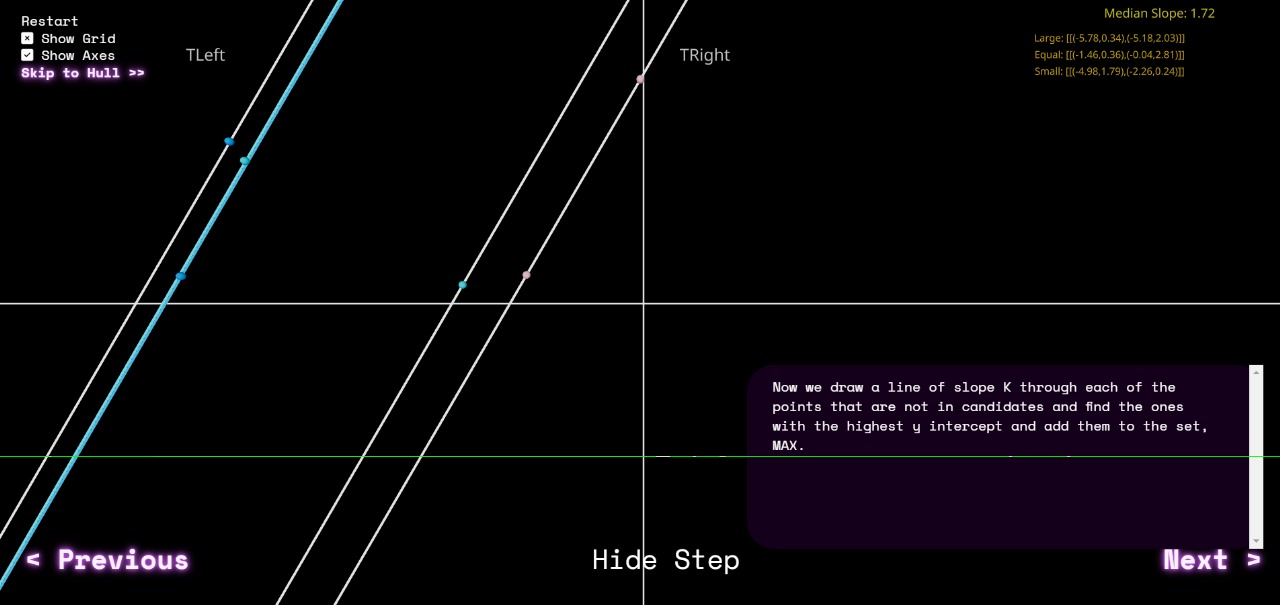
Now we draw a line of slope K through each of the points that are not in candidates and find the ones with the highest y intercept and add them to the set, MAX.
Step 8:
The point with the minimum x-coordinate is pK and maximum x-coordinate is pM. Now we check relation between them and update candidates. If pK lies on left side of median and pM lies on right side, we have found our bridge. If both are on right side of median, insert the 2nd points in pairs that are a part of LARGE and EQUAL and all points in SMALL into candidates. Else, insert the 2nd points in pairs that are a part of SMALL and EQUAL and all points in LARGE to candidates and find UpperBridge(Candidates,median).
Step 9:
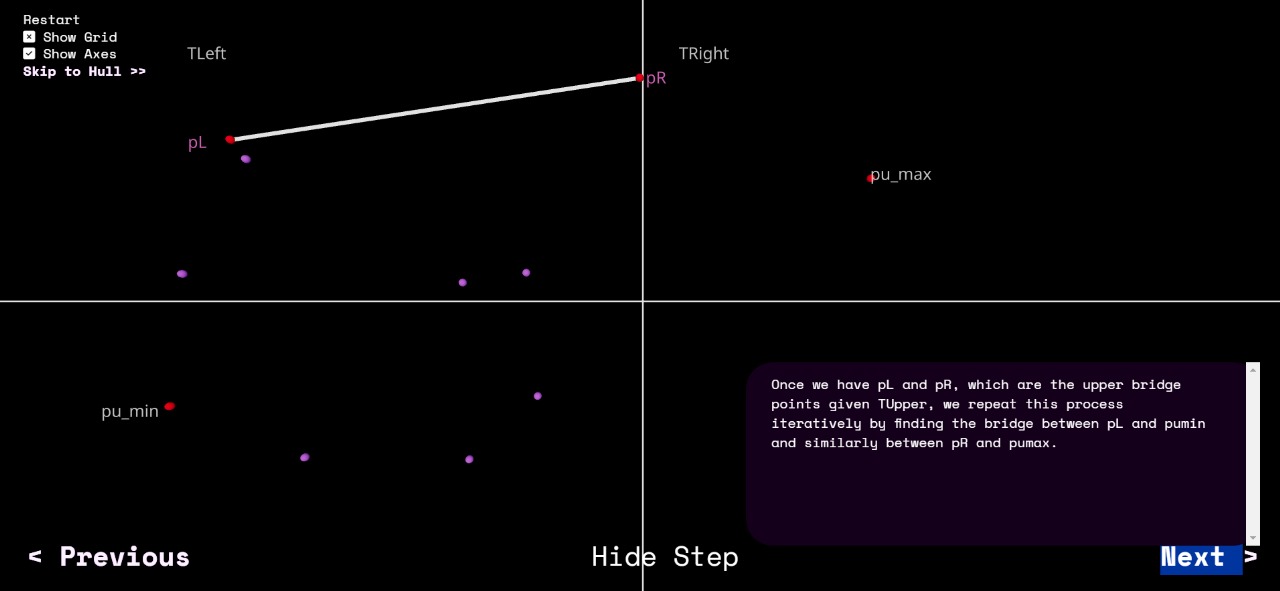
Once we have pL and pR, which are the upper bridge points given TUpper, we repeat this process iteratively by finding the bridge between pL and pumin and similarly between pR and pumax.
Step 10:
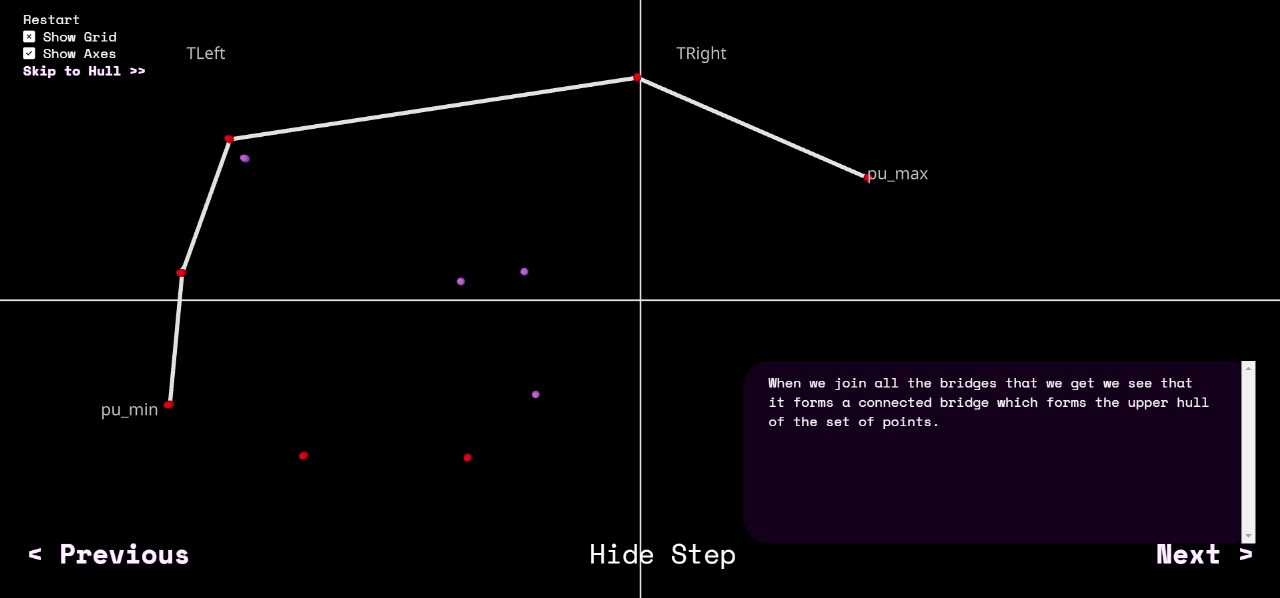
When we join all the bridges that we get we see that it forms a connected bridge which forms the upper hull of the set of points.
Step 11:
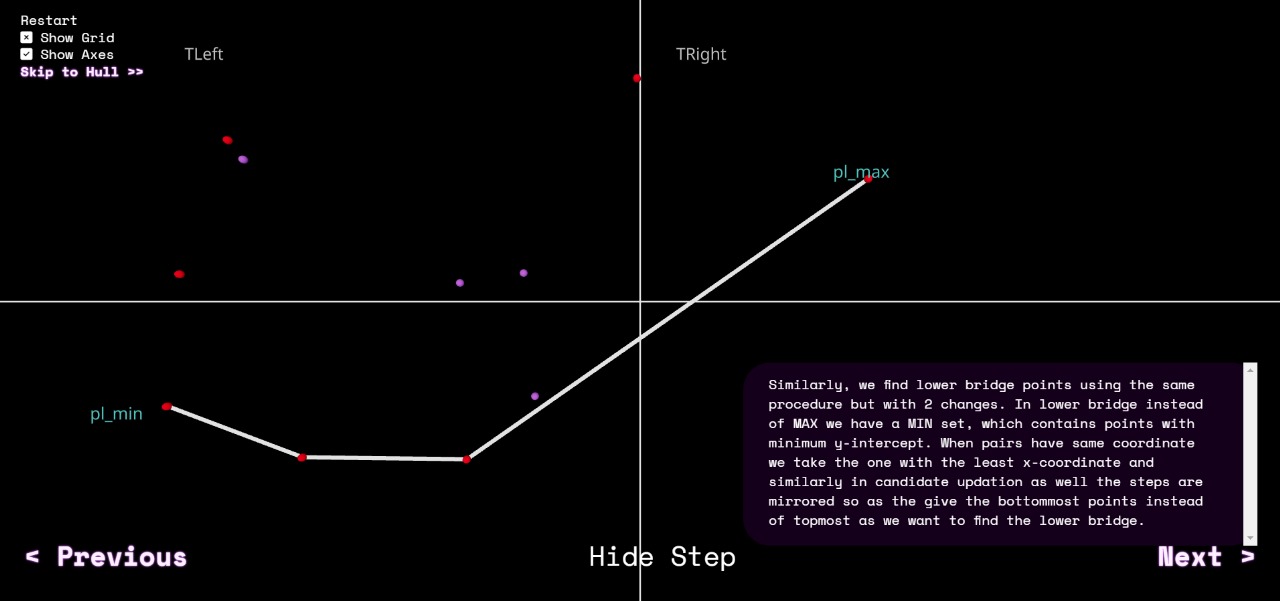
Similarly, we find lower bridge points using the same procedure but with 2 changes. In lower bridge instead of MAX we have a MIN set, which contains points with minimum y-intercept. When pairs have same coordinate we take the one with the least x-coordinate and similarly in candidate updation as well the steps are mirrored so as the give the bottommost points instead of topmost as we want to find the lower bridge.
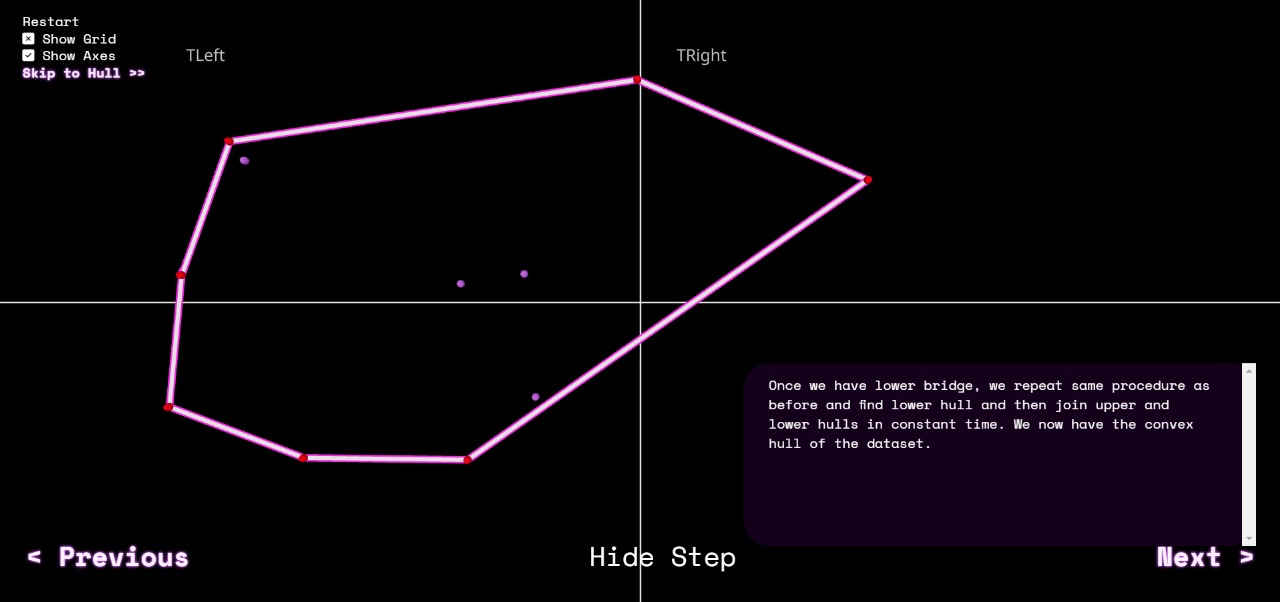
Step 12:
Once we have lower bridge, we repeat same procedure as before and find lower hull and then join upper and lower hulls in constant time. We now have the convex hull of the dataset.